
Will Muggia
President, Chief Executive Officer & Chief Investment Officer
Growth Equity
Inception Date:
Strategy AUM:
BENCHMARK:
Status:
Vehicles:
A high-conviction all cap growth strategy targeting underappreciated growth wherever it lives—drawing on the flexibility of an all cap mandate and the discipline of our process to build portfolios that adapt and perform across market cycles.
All Cap Growth Equity is built on the belief that stock prices ultimately follow earnings growth. We seek to identify businesses with strong fundamentals, underappreciated earnings potential, and durable competitive advantages — the companies we believe are best positioned to outperform over time. With the flexibility to allocate where we see the most compelling opportunities, the strategy can pivot across market caps as conditions evolve.
The strategy is managed by Westfield’s Investment Committee — a tenured group of sector specialists with deep domain expertise across the market cap spectrum. Their focus on both secular and cyclical growth opportunities enables us to build a portfolio that is not only diversified across end markets, but also positioned to capture multiple drivers of earnings acceleration across market cycles.
Key attributes of our approach include:
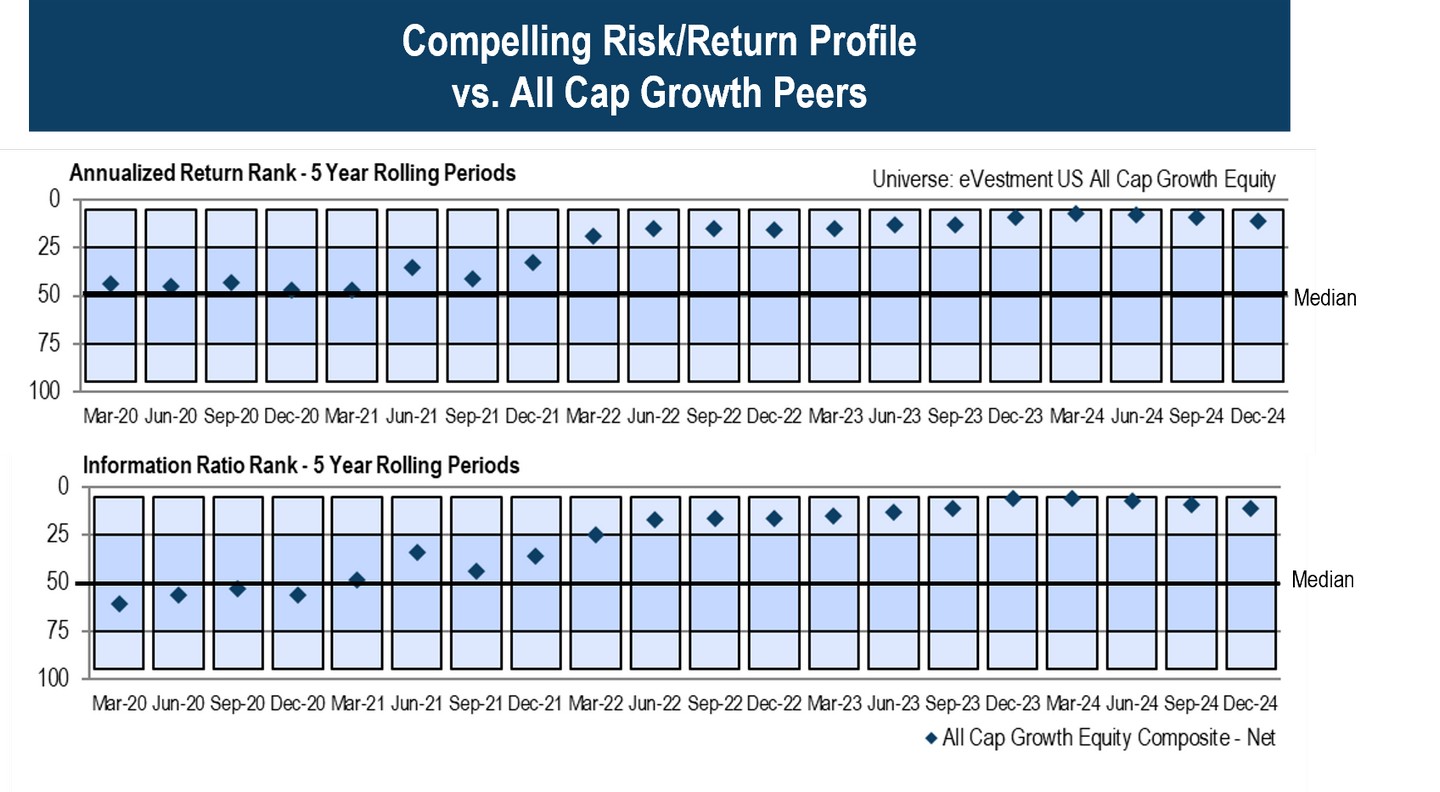
Chart source: eVestment, data is as of 12/31/24 and performance is based on the All Cap Growth Composite, Net of Fees, vs. the eVestment U.S. All Cap Growth Equity Universe; compiled on 1/13/25. Performance information for the strategy and the Peer group is provided by eVestment. The Universe is determined by eVestment and subject to change. Any third-party data contained herein has been obtained from sources believed to be reliable, but the accuracy of the information cannot be guaranteed.
Performance and Exposures
Preliminary Rates of Return (%) - Periods Ending December 31, 2025
Composite - Gross:
QTD
0.20
YTD
14.59
1-Year
14.59
3-Year
30.44
5-Year
14.75
10-Year
17.29
SI (JUL-89)
13.42
Composite - Net:
QTD
0.06
YTD
13.96
1-Year
13.96
3-Year
29.74
5-Year
14.13
10-Year
16.60
SI (JUL-89)
12.62
Russell 3000® Growth:
QTD
1.14
YTD
18.15
1-Year
18.15
3-Year
30.25
5-Year
14.59
10-Year
17.59
SI (JUL-89)
11.45
As of December 31, 2025
| wdt_ID | wdt_created_by | wdt_created_at | wdt_last_edited_by | wdt_last_edited_at | Characteristic | Portfolio | Benchmark |
|---|---|---|---|---|---|---|---|
| 15 | nhoyt | 10/10/2025 04:17 PM | nhoyt | 10/10/2025 04:17 PM | Number of Holdings | 39 | 1,496 |
| 17 | nhoyt | 10/10/2025 04:17 PM | nhoyt | 10/10/2025 04:17 PM | 1-Year Asset Turnover | 58% | -- |
| 18 | nhoyt | 10/10/2025 04:17 PM | nhoyt | 10/10/2025 04:17 PM | Wtd. Avg. Market Cap ($M) | $1,950,331 | $2,017,971 |
| 19 | nhoyt | 10/10/2025 04:17 PM | nhoyt | 10/10/2025 04:17 PM | Cal Yr P/E 2026 ¹ | 27.5x | 28.1x |
| 20 | nhoyt | 10/10/2025 04:17 PM | nhoyt | 10/10/2025 04:17 PM | Forward EPS Growth 2026 ¹ | 25.10% | 25.00% |
| 21 | nhoyt | 10/10/2025 04:17 PM | nhoyt | 10/10/2025 04:17 PM | Tracking Error (5 Yr gross) ² | 3.63% | -- |
As of December 31, 2025
| wdt_ID | wdt_created_by | wdt_created_at | wdt_last_edited_by | wdt_last_edited_at | Security | Active Weight (%) | GICS Sector |
|---|---|---|---|---|---|---|---|
| 21 | nhoyt | 10/10/2025 04:18 PM | nhoyt | 10/10/2025 04:18 PM | Ascendis Pharma A/S Sponsored ADR | 4.03 | Health Care |
| 22 | nhoyt | 10/10/2025 04:18 PM | nhoyt | 10/10/2025 04:18 PM | Comfort Systems USA, Inc. | 1.99 | Industrials |
| 23 | nhoyt | 10/10/2025 04:18 PM | nhoyt | 10/10/2025 04:18 PM | AMETEK, Inc. | 1.82 | Industrials |
| 24 | nhoyt | 10/10/2025 04:18 PM | nhoyt | 10/10/2025 04:18 PM | Amazon.com, Inc. | 1.66 | Cons. Disc. |
| 25 | nhoyt | 10/10/2025 04:18 PM | nhoyt | 10/10/2025 04:18 PM | Bank of America Corp | 1.49 | Financials |
| 26 | nhoyt | 10/10/2025 04:18 PM | nhoyt | 10/10/2025 04:18 PM | Alphabet Inc. Class A+C | 1.52 | Comm. Srvs. |
| 27 | nhoyt | 10/10/2025 04:18 PM | nhoyt | 10/10/2025 04:18 PM | Snowflake, Inc. | 1.48 | Info. Tech. |
| 28 | nhoyt | 10/10/2025 04:18 PM | nhoyt | 10/10/2025 04:18 PM | UnitedHealth Group Incorporated | 1.40 | Health Care |
| 29 | nhoyt | 10/10/2025 04:18 PM | nhoyt | 10/10/2025 04:18 PM | FTAI Aviation Ltd. | 1.37 | Industrials |
| 30 | nhoyt | 10/10/2025 04:18 PM | nhoyt | 10/10/2025 04:18 PM | Axon Enterprise Inc | 1.31 | Industrials |
As of December 31, 2025
Source: FactSet. Representative Portfolio data shown as of 12/31/25 unless otherwise stated. Past performance is not indicative of future results - Please click here for GIPS® Compliant Presentation. Returns are annualized for periods greater than one year. Any third party data contained herein has been obtained from sources believed to be reliable, but the accuracy of the information cannot be guaranteed. ¹Cal Yr P/E 2025 and EPS Growth (2025 est.) for the portfolio is sourced from FactSet Street estimates for the current portfolio holdings and is subject to change. ²Strategy Composite data gross of fees. Active weights represent the top 10 active longs relative to the benchmark. Dual share classes are combined when calculating active weights. The holdings and percentages may not represent the current or future portfolio composition. Due to rounding and cash, sector weights may not sum to 100%. Portfolio characteristics may differ depending on specific client guidelines and restrictions.
Meet The Team