
Will Muggia
President, Chief Executive Officer & Chief Investment Officer
Growth Equity
Inception Date:
Strategy AUM:
BENCHMARK:
Status:
Vehicles:
A high-conviction, concentrated portfolio of growth companies with asymmetrical risk/rewards. Select Growth reflects our highest conviction ideas—sized to drive alpha while prudently managing risk.
Select Growth Equity is built on the belief that investing in a concentrated portfolio of growth companies with asymmetrical risk / reward profiles offers the best opportunity to maximize return while managing risk responsibly. The portfolio aims to strike a deliberate balance between high-quality compounders with accelerating earnings growth and catalyst-driven growth opportunities-believing that thoughtful exposure to both enhances consistency and long-term results.
The strategy is managed by Will Muggia, President, CEO & CIO, and supported by the firm’s tenured Investment Team — a group of sector specialists with deep domain expertise across the market cap spectrum. Ideas are sourced through Westfield’s deep sector coverage and refined through collaborative discussion.
Key attributes of the approach include:
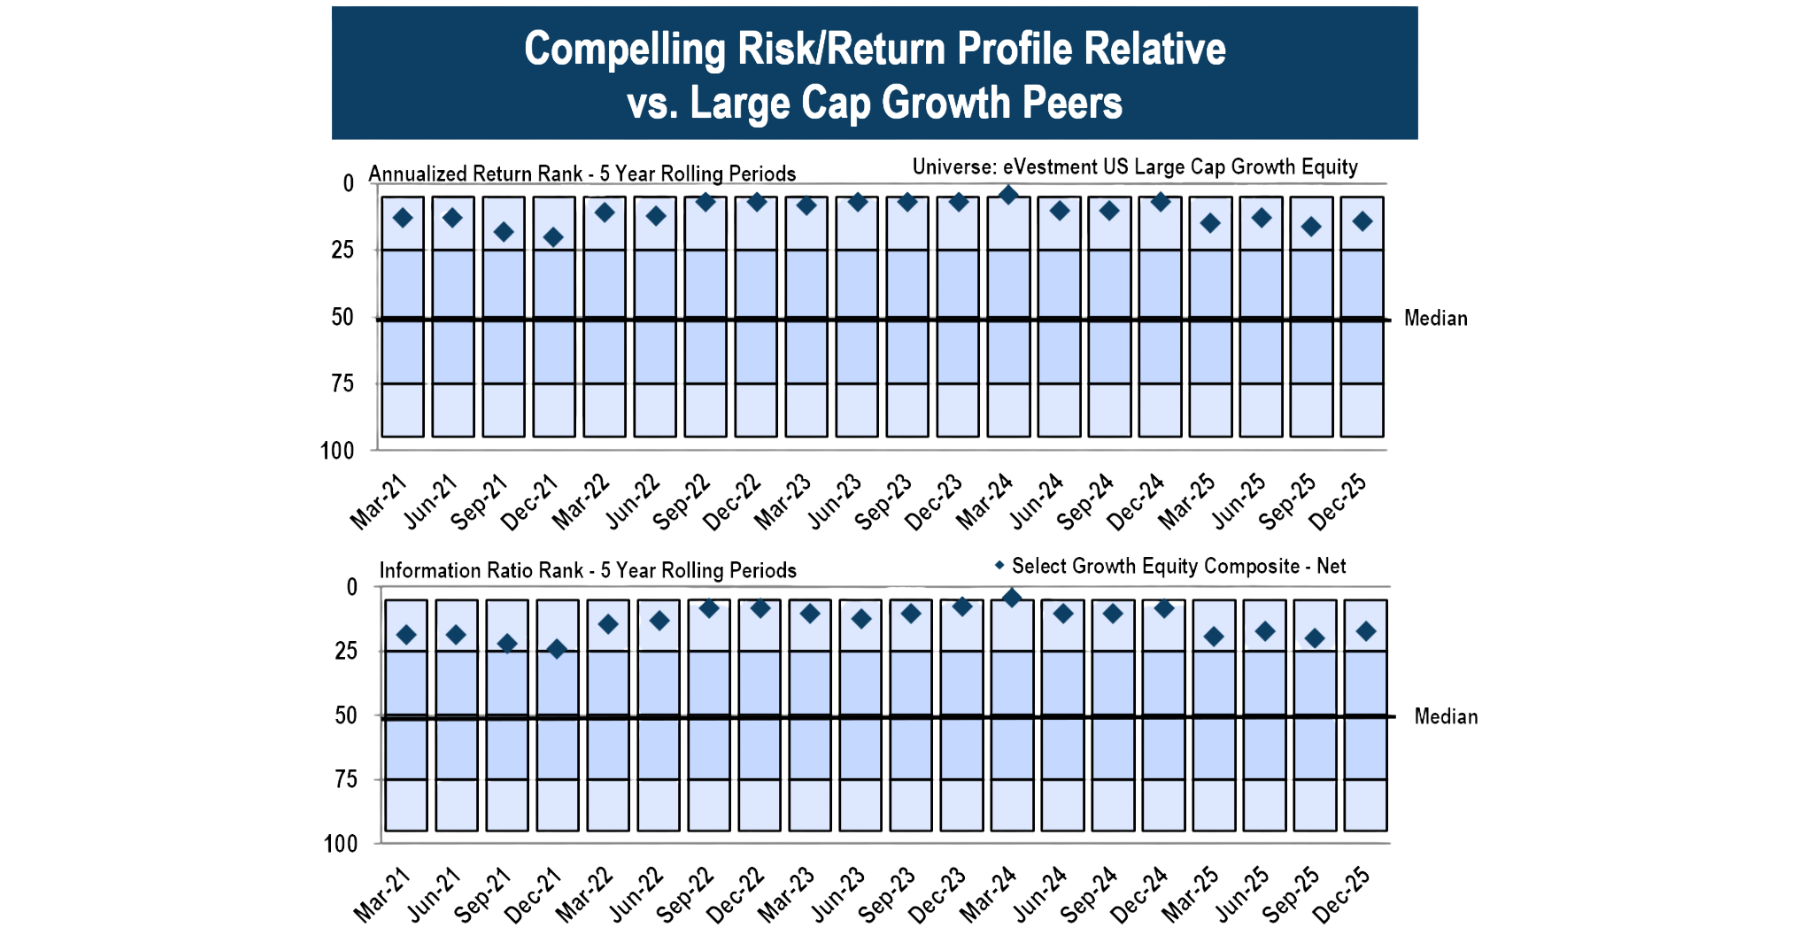
Chart source: eVestment, data is as of 12/31/25 and performance is based on the Select Growth Composite, Net of Fees, vs. the eVestment U.S. Large Cap Growth Equity Universe; compiled on 1/13/25. Performance information for the strategy and the Peer group is provided by eVestment. The Universe is determined by eVestment and subject to change. Any third-party data contained herein has been obtained from sources believed to be reliable, but the accuracy of the information cannot be guaranteed.
Performance and Exposures
Preliminary Rates of Return (%) - Periods Ending December 31, 2025
Composite - Gross:
QTD
0.84
YTD
17.86
1-Year
17.86
3-Year
33.25
5-Year
15.77
10-Year
19.06
SI (JAN-14)
17.76
Composite - Net:
QTD
0.74
YTD
17.39
1-Year
17.39
3-Year
32.50
5-Year
15.03
10-Year
18.21
SI (JAN-14)
16.91
Russell 1000® Growth:
QTD
1.12
YTD
18.56
1-Year
18.56
3-Year
31.15
5-Year
15.32
10-Year
18.13
SI (JAN-14)
16.61
As of December 31, 2025
| wdt_ID | wdt_created_by | wdt_created_at | wdt_last_edited_by | wdt_last_edited_at | Characteristic | Portfolio | Benchmark |
|---|---|---|---|---|---|---|---|
| 15 | nhoyt | 10/10/2025 04:22 PM | nhoyt | 10/10/2025 04:22 PM | Number of Holdings | 32 | 391 |
| 17 | nhoyt | 10/10/2025 04:22 PM | nhoyt | 10/10/2025 04:22 PM | 1-Year Asset Turnover | 86% | -- |
| 18 | nhoyt | 10/10/2025 04:22 PM | nhoyt | 10/10/2025 04:22 PM | Wtd. Avg. Market Cap ($M) | $1,948,576 | $2,027,191 |
| 19 | nhoyt | 10/10/2025 04:22 PM | nhoyt | 10/10/2025 04:22 PM | Cal Yr P/E 2026 ¹ | 30.1x | 28.5x |
| 20 | nhoyt | 10/10/2025 04:22 PM | nhoyt | 10/10/2025 04:22 PM | Forward EPS Growth 2026 ¹ | 25.40% | 24.50% |
| 21 | nhoyt | 10/10/2025 04:22 PM | nhoyt | 10/10/2025 04:22 PM | Tracking Error (5 Yr gross) ² | 4.23% | -- |
As of December 31, 2025
| wdt_ID | wdt_created_by | wdt_created_at | wdt_last_edited_by | wdt_last_edited_at | Security | Active Weight (%) | GICS Sector |
|---|---|---|---|---|---|---|---|
| 31 | nhoyt | 10/10/2025 04:23 PM | nhoyt | 10/10/2025 04:23 PM | Ascendis Pharma A/S Sponsored ADR | 5.40 | Health Care |
| 32 | nhoyt | 10/10/2025 04:23 PM | nhoyt | 10/10/2025 04:23 PM | Howmet Aerospace Inc. | 2.76 | Industrials |
| 33 | nhoyt | 10/10/2025 04:23 PM | nhoyt | 10/10/2025 04:23 PM | Comfort Systems USA, Inc. | 2.62 | Industrials |
| 34 | nhoyt | 10/10/2025 04:23 PM | nhoyt | 10/10/2025 04:23 PM | FTAI Aviation Ltd. | 2.57 | Industrials |
| 35 | nhoyt | 10/10/2025 04:23 PM | nhoyt | 10/10/2025 04:23 PM | Axon Enterprise Inc | 2.54 | Industrials |
| 36 | nhoyt | 10/10/2025 04:23 PM | nhoyt | 10/10/2025 04:23 PM | Bank of America Corp | 2.14 | Financials |
| 37 | nhoyt | 10/10/2025 04:23 PM | nhoyt | 10/10/2025 04:23 PM | Ares Management Corporation | 1.86 | Financials |
| 38 | nhoyt | 10/10/2025 04:23 PM | nhoyt | 10/10/2025 04:23 PM | Parker-Hannifin Corporation | 1.61 | Industrials |
| 39 | nhoyt | 10/10/2025 04:23 PM | nhoyt | 10/10/2025 04:23 PM | Coherent Corp. | 1.52 | Info. Tech. |
| 40 | nhoyt | 10/10/2025 04:23 PM | nhoyt | 10/10/2025 04:23 PM | Taiwan Semiconductor Manufacturing Co. | 1.49 | Info. Tech. |
As of December 31, 2025
Source: FactSet. Representative Portfolio data shown as of 12/31/25 unless otherwise stated. Past performance is not indicative of future results - Please click here for GIPS® Compliant Presentation. Returns are annualized for periods greater than one year. Any third party data contained herein has been obtained from sources believed to be reliable, but the accuracy of the information cannot be guaranteed. ¹Cal Yr P/E 2025 and EPS Growth (2025 est.) for the portfolio is sourced from FactSet Street estimates for the current portfolio holdings and is subject to change. ²Strategy Composite data gross of fees. Active weights represent the top 10 active longs relative to the benchmark. Dual share classes are combined when calculating active weights. The holdings and percentages may not represent the current or future portfolio composition. Due to rounding and cash, sector weights may not sum to 100%. Portfolio characteristics may differ depending on specific client guidelines and restrictions.
Meet The Team