While growth headwinds from tariffs and immigration policy remain on the horizon, they appear outweighed by powerful tailwinds — from Fed policy support to improving market breadth. We believe the conditions are in place for the market to broaden out and grind higher, with small caps – along with other laggards such as Healthcare and Cyclicals- well-positioned for a catch up.
The Time for Small Caps is Now
- Valuation Asymmetry: Small caps trade at an extreme 30-year discount to large caps, effectively ‘left for dead’ despite improving fundamentals.
- Earnings Inflection: 2Q25 marks the first positive earnings growth in ten quarters. Historically, small-cap earnings cycles last ~15 quarters, suggesting a potential upswing through 2026.
- Rate-Cut Tailwinds: Coming Fed rate cuts should disproportionately benefit small caps given their higher financing sensitivity and reliance on credit markets.
- Reallocation Math: The top 5 stocks by market cap now represent over 25% of the S&P 500. A 5% shift out of these names would equal ~25% of the market cap of the Russell 2000 — showing how powerful even modest rotations could be.
Takeaway: Earnings are inflecting, valuations are at generational lows, and rate cuts loom — a compelling setup for small-cap outperformance.
Charts: Small vs. large cap relative performance


Source: Furey Research Partners, as of 8/13/2025
Charts: Extreme Small-Cap Apathy: Flows and Price Stagnation at Multi-Year Lows
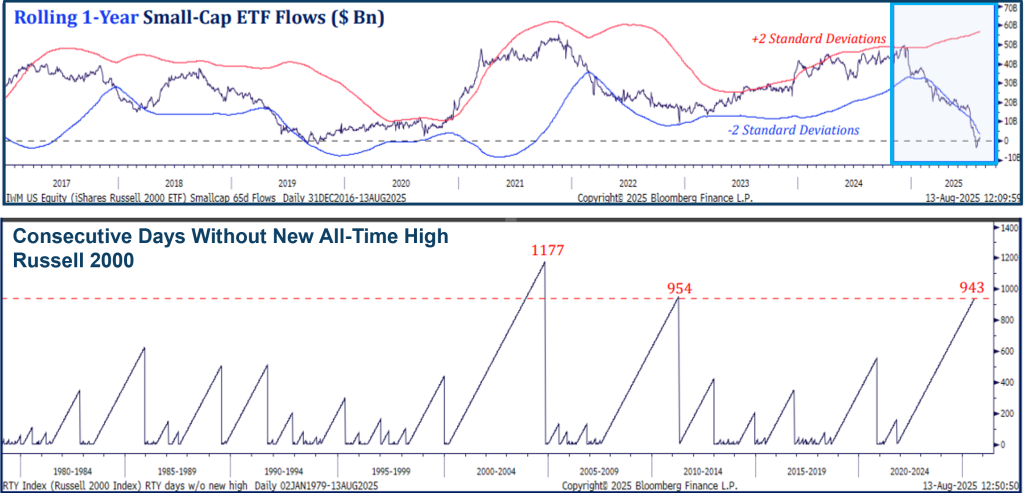
Source: Strategas Research Partners, as of 8/14/2025
Charts: Market Concentration: Scale of Top Stocks vs. Russell 2000

Source: FactSet, as of 8/24/2025
Areas We Like:
- Healthcare & Biotech: Healthcare has lagged badly, leaving valuations at multi-decade lows. We see meaningful catch-up potential as flows rotate to under-owned segments. We believe Biotech, in particular, stands to benefit from lower rates given financing sensitivity, robust M&A and an active pipeline of innovation.
- Industrials & Cyclicals: The current Industrial recession is emerging from one of the longest downturns in modern history — over two years of contraction. With Fed easing, stimulus measures, and leading indicators turning higher, we believe Cyclicals are set up for a recovery into 2026. The combination of rate cuts and reversion to the mean creates significant catch-up potential.
Takeaway: Beyond small caps broadly, we see particularly compelling opportunities in Healthcare and Industrials — two areas where cheap valuations, cyclical tailwinds, and rate sensitivity provide a favorable setup for relative outperformance.
Chart: Biotech Weakness Sets the Stage for Catch-Up

Source: FactSet of 8/25/2025
Chart: Industrials Poised for Cyclical Recovery
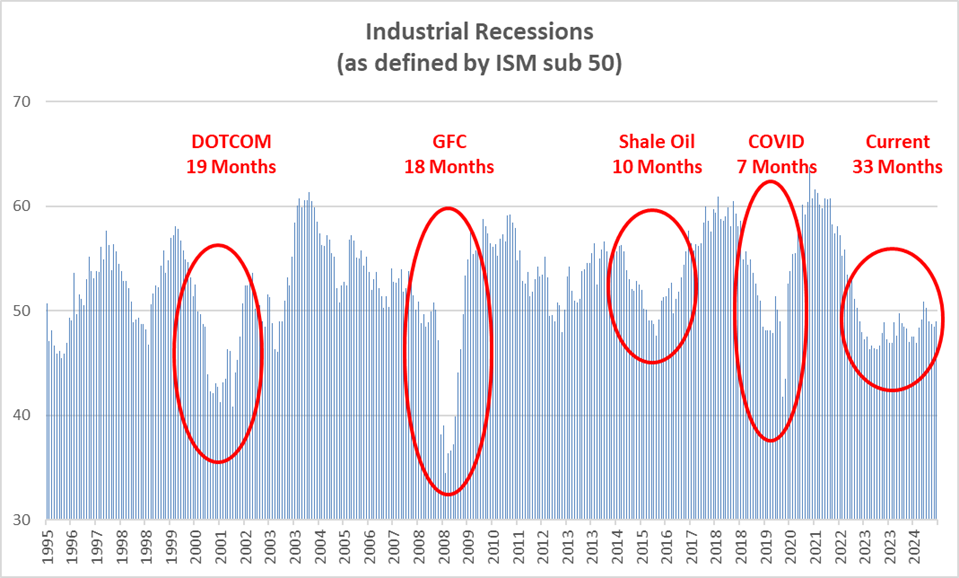
Source: Bloomberg, as of 8/21/2025
Conclusion
After more than a decade of underperformance, small caps are showing early signs of earnings and sales acceleration just as valuations sit at generational lows. Combined with extreme apathy in flows and historic concentration in large caps, we believe the next phase is set up for laggards — particularly small caps, Healthcare, and Industrials — to attract capital from Mega Caps.
Important Disclosures
The views expressed are those of Westfield Capital Management Company, L.P. as of the date referenced and are subject to change at any time based on market or other conditions. These views are not intended to be and should not be relied upon as investment advice and are not intended to be a forecast of future events or a guarantee of future results. The information provided in this material is not intended to be and should not be considered to be a recommendation or suggestion to engage in or refrain from a particular course of action or to make or hold a particular investment or pursue a particular investment strategy, including whether or not to buy, sell, or hold any of the securities mentioned. It should not be assumed that investments in such securities have been or will be profitable. Past performance is not indicative of future results.
Some of the content on the preceding pages has been supplied by companies that are not affiliated with Westfield (“third party data”). Any third-party data contained herein has been obtained from sources believed to be reliable, but the accuracy of the information cannot be guaranteed.
These materials are being provided on the basis that they and any related communications will not cause Westfield to become an investment advice fiduciary under ERISA or the Internal Revenue Code with respect to any retirement plan or IRA investor, as the recipients are fully aware that Westfield (i) is not undertaking to provide impartial investment advice, act as an impartial adviser, or give advice in a fiduciary capacity, and (ii) has a financial interest in the offering and sale of one or more products and services, which may depend on a number of factors relating to Westfield’s internal business objectives, and which has been disclosed to the recipient.