Key Takeaways
- The 2025 market was characterized by extreme concentration and a lower quality rally that created significant headwinds for traditional active management
- 2025 marked the fifth consecutive year the median Mid Cap Growth manager underperformed the benchmark. In only three of the last twenty years has the median manager outperformed—the message is clear: being average in Mid Cap Growth is not good enough. Only a select group of active managers have demonstrated the ability to outperform across cycles.
- Looking ahead, the market is transitioning toward broader participation and cyclical acceleration, with Mid Cap Growth showing attractive relative valuations and strong earnings growth outlook for 2026.
- In our view, to outperform today’s Mid Cap Growth benchmark requires more than stock-picking. It demands a comprehensive approach that combines robust risk management, benchmark awareness, and the flexibility to adapt to changing market dynamics.
What Happened in 2025?
The Mid Cap Growth benchmark evolved into a higher-momentum, higher-risk index in 2025, creating a particularly challenging environment for active managers. The market was characterized by extreme concentration, with the Russell Midcap Growth Index’s top 10 contributors surging 82% compared to just 8.7% for the overall index. Only 48% of stocks in the benchmark beat the index—a remarkably narrow market that made relative positioning increasingly critical.
Perhaps more striking was the nature of the performance leadership. In a significant quality inversion, the lowest ROE quintile beat the highest ROE quintile by 42% over nine months—one of the biggest outperformances by lower quality stocks in recent history. The most significant index contributions came from the highest P/E quintile and non-earners, underscoring the speculative nature of 2025’s rally.
Retail participation played an outsized role in driving this dynamic. Retail investors represented over 20% of daily trading volume, with nearly 25% of all volume occurring in stocks priced below $5 (source: Jefferies, FactSet). This combination of concentration, lower quality leadership, and retail-driven momentum created significant headwinds for traditional active management approaches.
Table: Russell Mid Cap Growth Top 10 Contributors

Source: FactSet, FTSE Russell, Jefferies. Performance is for calendar year 2025 through December 31st.
Table: Russell Midcap Growth: 2025 Performance by ROE Quintile
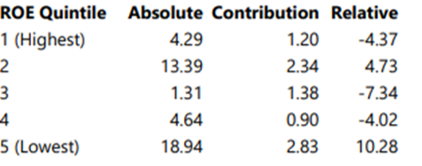
Source: FactSet, FTSE Russell, Jefferies.
Fifth Straight Year of Active Manager Struggle
The challenging backdrop resulted in the average Mid Cap Growth manager posting -3.8% alpha in 2025, marking the fifth consecutive year of median manager underperformance. This extended period of underperformance underscores the difficulty of generating consistent alpha in this asset class and highlights why a differentiated approach is essential. The message is clear: average is not acceptable in Mid Cap Growth.
Chart: Mid Cap Growth Manager Performance
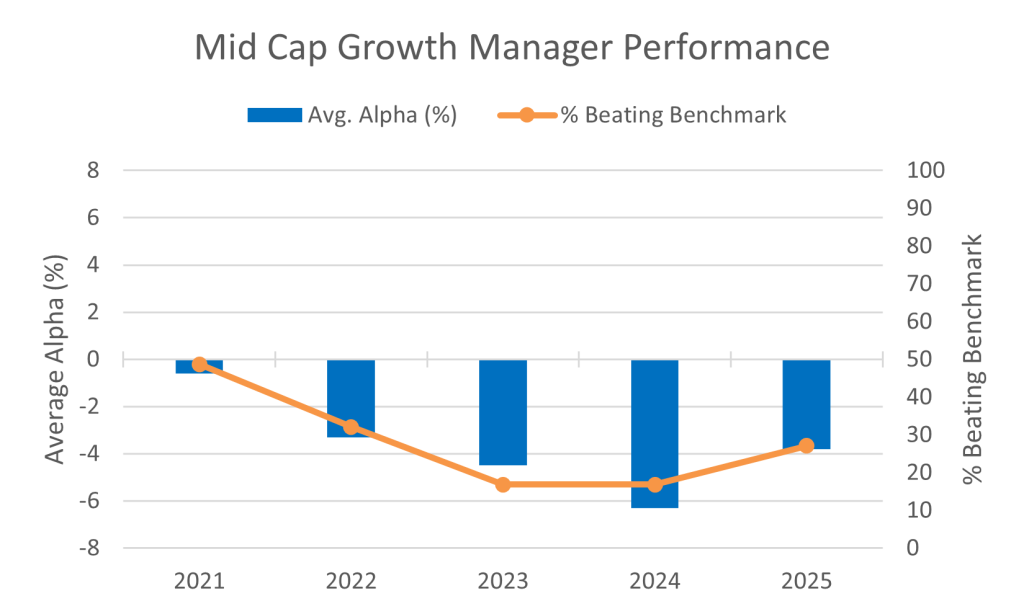
Source: FactSet; Lipper Analytical Services; FTSE Russell; Jefferies Note: 2025 performance is through December 31, 2025
Looking Forward – More Constructive Backdrop for Active
We believe the market is transitioning away from the narrow, low-quality leadership that characterized 2025.
- Speculative excesses that reached extremes in late 2025—including quantum stocks and meme stocks—have experienced meaningful corrections, suggesting froth is being removed from the market.
- At the same time, cyclical indicators are improving, with recent PMI data showing manufacturing activity strengthening. Perhaps most importantly, the market is increasingly rewarding companies with sound fundamentals over pure speculation.
Mid Cap Growth Offers the Best Earnings Growth Outlook. Mid Cap Growth is showing superior earnings growth compared to size and style peers for 2026, providing fundamental support for the asset class. Early 2026 performance is already confirming broader market participation.
Cyclical Acceleration. Recent PMI data shows manufacturing activity strengthening. Historically, periods of broader earnings and market participation have been favorable for cyclical stocks, and we are seeing early evidence of this dynamic playing out.
Quality Matters Again. After an extended period where the lowest quality stocks dramatically outperformed, we are seeing signs of normalization. Speculative excesses in quantum stocks and meme stocks have corrected, and the market is increasingly rewarding sustainable business models over speculation.
Attractive Relative Valuations. Mid Cap stocks are trading at a significant valuation discount to Large Cap, with mid caps at approximately 15x forward P/E versus 22x for the S&P 500.
Chart: Relative Valuations Highlight Opportunities Beyond Mega Caps

Source: BofA Global Investment Strategy, Bloomberg, as of 12/2/2025
Chart: Industrial Activity Stabilizing After the Longest Contraction on Record
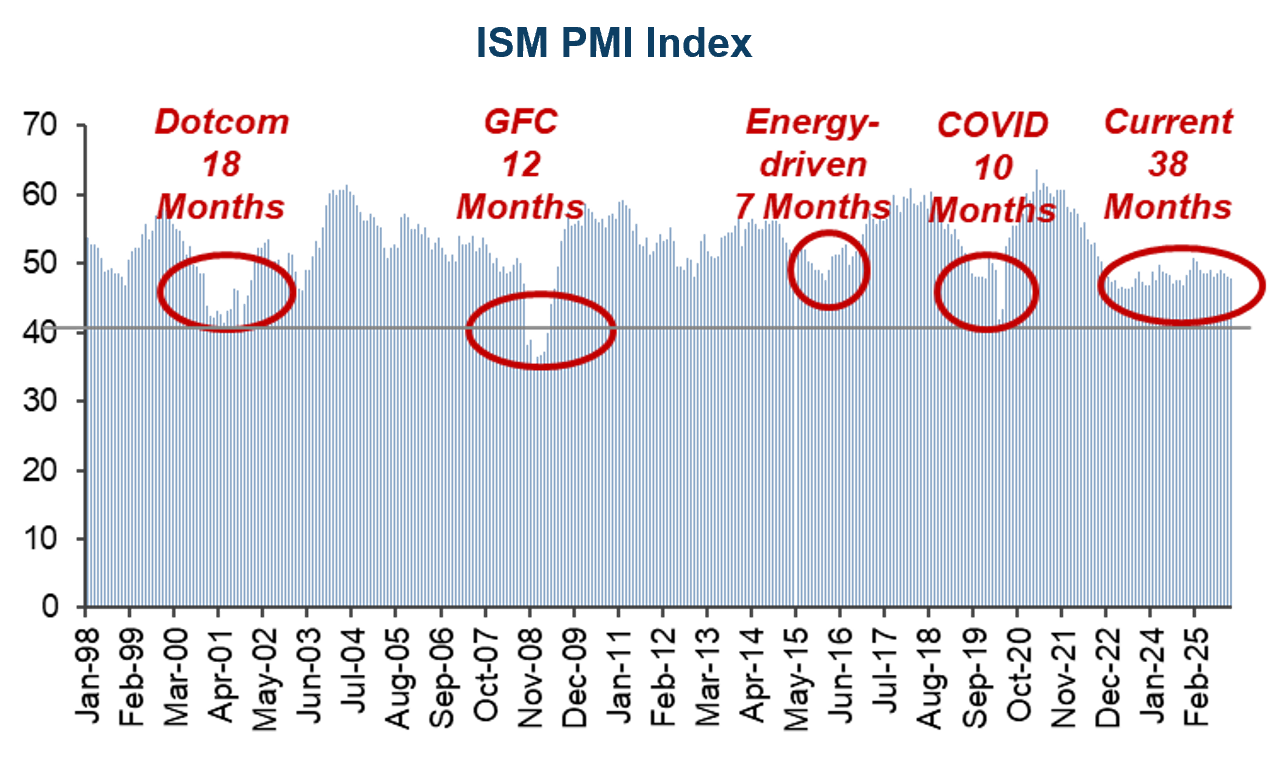
Source: Bloomberg as of 12/31/25
Health Care Relative Performance Is Showing Early Signs of a Turn

Source: FactSet, as of 1/5/2026
Financials & Industrials Are Breaking Out of Multi-Quarter Ranges

Source: FactSet, as of 1/5/2026
Conclusion
The Mid Cap Growth landscape presents a clear challenge and a compelling opportunity. After five consecutive years of median manager underperformance, undifferentiated active management has proven insufficient. Yet the investment landscape is compelling. Speculative excesses have corrected, cyclical indicators are strengthening, and early sector rotation signals that market leadership is broadening beyond the narrow cohort that dominated 2025. Mid Cap Growth now offers attractive valuations alongside superior earnings growth relative to peers. This transition creates meaningful opportunities for active managers with the discipline and flexibility to capitalize on a more balanced market environment. Success will require moving beyond traditional stock-picking toward a comprehensive approach that integrates robust risk management with adaptability across market cycles.
>Read more on our Mid Cap Strategy
Important Disclosures
The views expressed are those of Westfield Capital Management Company, L.P. as of the date referenced and are subject to change at any time based on market or other conditions. These views are not intended to be and should not be relied upon as investment advice and are not intended to be a forecast of future events or a guarantee of future results. The information provided in this material is not intended to be and should not be considered to be a recommendation or suggestion to engage in or refrain from a particular course of action or to make or hold a particular investment or pursue a particular investment strategy, including whether or not to buy, sell, or hold any of the securities mentioned. It should not be assumed that investments in such securities have been or will be profitable.
Past performance is not indicative of future results.


